
Quenching of steels consists in heating a component such as it goes into an austenitic state and then applying a cooling to transform the austenite. A rapid quenching process produces a martensitic transformation, a slow one is likely to generate pearlite, with the remaining austenite corresponding to a partly hard structure. Heat treatment gives the material its final properties and microstructure depending on its cooling rate. Different quenching methods exist: immersing into a bath, jet impingement and spray quenching.

What is spray quenching?
Spray quenching is a heat treatment process based on the quenching method, where the metal part is spray-cooled with a quenchant. After heating, the part’s hot surface is sprayed with a jet of gas carrying small droplets to be cooled to the desired temperature. The quenchant used can be water or oil media.
Compared to other quenching techniques, spray quenching has the advantages of providing high heat transfer and achieving uniform heat removal. It is also a very flexible method as it is possible to apply a wide amplitude of cooling rates by simply adapting the water flow rates.
In spray quenching, the heat transfer coefficient (HTC) varies with:
- Spray angle
- Distance to the surface
- Relative angle between spray & surface
- Spray water flow rate
- etc.
Benefits of predictive simulation
SIMHEAT® simulation software can be used to:
- Model the spray flow and orientation
- Predict temperature, phase transformation, HV or HRC hardness, distortion, residual stress, yield stress, etc.
- Generate the Kirkaldy-based TTT diagram for low alloy steel grades
- Anticipate distortions that can occur on any kind of metal, including aeronautic alloys
- Track material characteristics during heat treatment

Competitive features of SIMHEAT® for spray quenching
- SIMHEAT® integrates a thermal, mechanical and metallurgical coupled model. Read more
- The optimization module provides the calculation of the spray water flow rate and spray orientation by means of an inverse analysis method.
- The design of the spray quenching equipment can be customized by defining the number of spray columns, the distance between sprays, the spray flow rate, etc.
Modeling of vertical spray quenching with SIMHEAT®
- A dedicated tool is included to create continuous cooling transformation (CCT) or time-temperature transformation (TTT) diagrams for low alloy steel.
- Distortion models are available and applicable to all kinds of metals, including aeronautic alloys.
- Material characteristics can be tracked during the heat treatment by defining sensors.
Case study: spray quenching of a large shaft at Ofar (Giva Group)
A case study developed in collaboration with the Italian company Ofar (Giva Group) on the spray quenching of a large shaft is presented below.
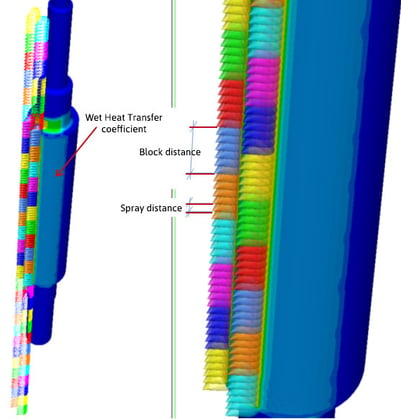
 Figure 1 represents the heat transfer values applied on the shaft’s surface, depending on the process conditions. It can be observed that this heat transfer is not constant, and in this example the major influence was related to the spray position and orientation.
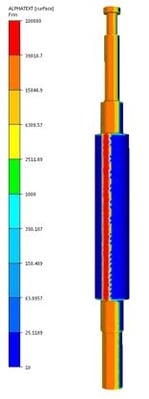
Figure 1 - Heat transfer coefficient distribution
A sensor was used to record the temperature evolution on the shaft’s surface. In the following graph, we see the temperature evolution during quenching. We can observe how the temperature recorded by the sensor decreases over time.
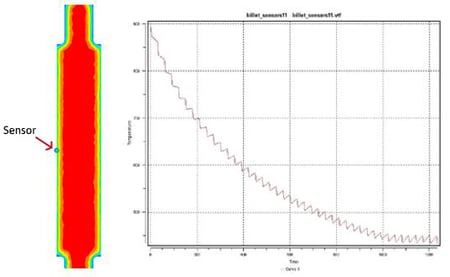
Figure 2a – Sensor defined to record the temperature evolution of the shaft’s surface
Figure 2b – Temperature evolution during quenching
Figure 3 shows the phase distribution after quenching. A bainite phase is present in the center of the shaft. On the boundary, since the cooling is faster, we can observe the appearance of a martensite phase.
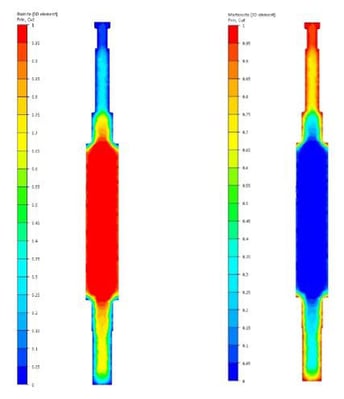
Figure 3 - Phase distribution (bainite and martensite) after spray quenching: bainite (left) and martensite (right)
Figure 4 presents the effect of quenching on the first principal stress:
- Negative values in blue show high compressive areas.
- Positive values in yellow and red show high tensile areas.
Residual stresses can be observed in the final step of the animation.
Figure 4 - First principal stress evolution during quenching
In this animation, displacement has been amplified by 10 in order to show the distortions induced by the spray quenching process. Thus, it is possible to easily compare the non-deformed model with the final distorted geometry obtained after quenching.
To compensate the distortions, machining is applied in almost all circumstances and our teams are working on modeling for this specific stage. In the near future, it will be possible to model residual stress relaxation after machining.
